A new web tool, COVID-19 Pandemic Trade-offs, allows people to weigh the costs and benefits of different policy responses as Australia rolls out vaccines and considers opening borders.
See here for an associated explanatory video. Article reproduced with permission from Pursuit
The burning COVID-19 question this year is – “When can we get back to normal?” Or more pessimistically, “Will we ever get back to normal?”
The honest answer is we do not know, and only time will tell.
Moreover, we are privileged in Australasia to have little-to-zero community transmission, giving us some space to learn from other countries as they aggressively roll out emergency vaccination programs.
However, keeping our borders closed to the world indefinitely is not feasible and we need to start planning and assessing our options.
To that end, we have used our peer reviewed agent-based model to estimate infection rates as well as the different health losses and gains across hundreds of scenarios during the vaccine rollout as a way to road test different policy options.
It is an updated version of the model that underpins the Victorian RoadMap, and has been coupled with an integrated epidemiological and economic model that we have already used to estimate the net health gains, losses and costs for the Australian state of Victoria in 2020.
We have now made it available as a web tool – called COVID-19 Pandemic Trade-offs – so that policymakers and the public can themselves assess different policy responses under different scenarios.
The model broadly applies four distinct policy options:
- Aggressive elimination – approximating the intensity of response taken in New Zealand and Victoria in 2020
- Moderate elimination – approximating the responses by New South Wales to outbreaks (later to lockdown, earlier out, rely more on contact tracing – but still trying to eliminate)
- Tight suppression – approximating the South Korea approach to keeping numbers low, but not going for elimination
- Loose suppression – approximating Europe before Christmas 2020– ‘living with the virus’.
The model assumes six infected persons at the outset. It models further viral incursions (mimicking quarantine failures and some relaxation of borders increasing over time) starting at about a one per cent probability per day and increasing by 16-fold by the end of the vaccine rollout but with considerable variability.
The model has the following variables that can be adjusted using the web tool:
- Relaxing policy approaches as vaccine coverage increases.
- Adjusting the infection (reproductive) rate of the virus.
- Varying the level of vaccine coverage achieved.
- Varying the effectiveness of vaccines at reducing transmission.
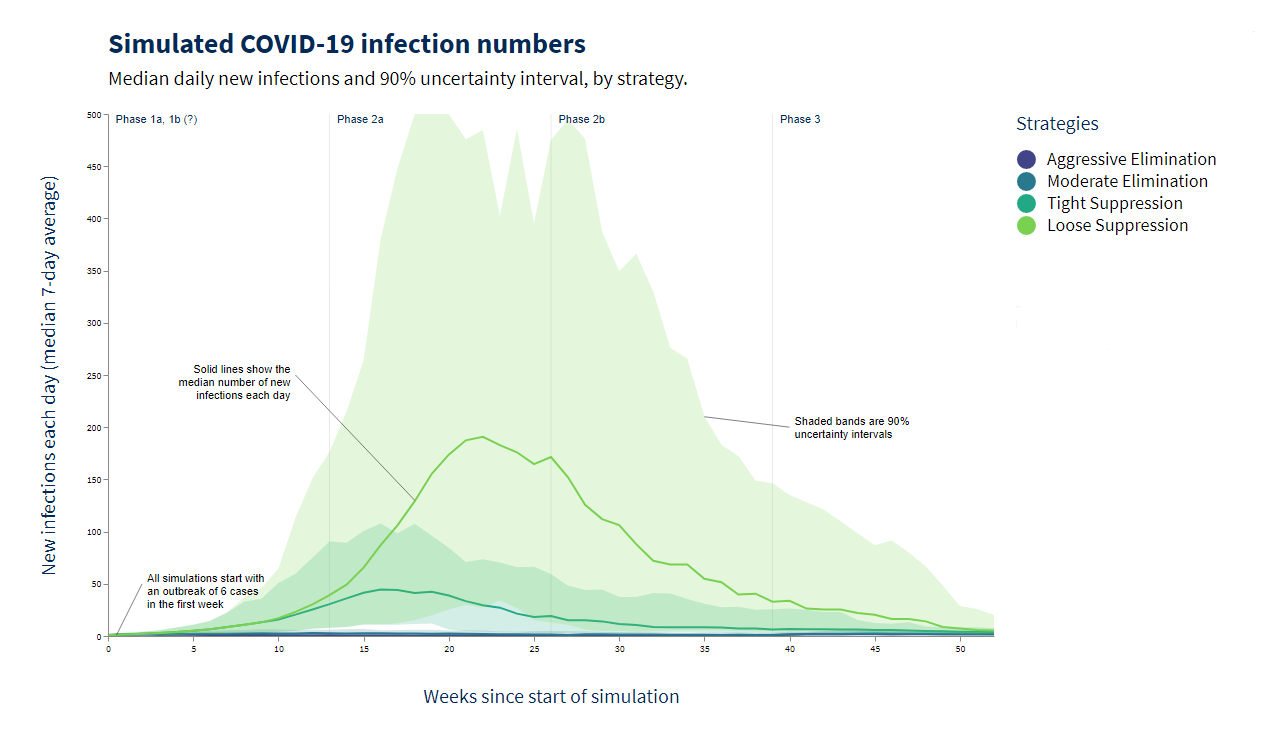
An example of a graph from the COIVD-19 Pandemic Trade-offs tool. This example simulated average daily infections based on 75 per cent vaccine coverage, a Reproduction Rate of 3.125, and vaccine effectiveness at reducing transmission set at 75 per cent. The two elimination options keep infection rates very low, but not the suppression options. Graph: Supplied
The health impacts associated with lockdowns were determined from an international literature search, that we specified in models in terms of ratio increases (decreases) in disease morbidity and/or mortality.
Our own interpretation of what the model suggests is that:
- The likelihood of future uncontrolled outbreaks is – unsurprisingly – considerably greater if we adopt a loose suppression approach too soon.
- The risk varies markedly with the different infection rates (R0) of the various COVID-19 variants. Therefore, the greater infectivity of new variants is of grave concern until vaccine coverage is high enough to effectively reduce transmission.
For example, across 216 scenarios we found that a more infectious variant combined with looser policy responses results in very high daily infection rates.
However, the modelling also suggests that the other health impacts (e.g. depression, anxiety) incurred by an aggressive elimination strategy (strict and extended lockdowns in response to outbreaks) can outweigh the benefits as vaccine coverage increases.
Finding an exact ‘sweet spot’ that keeps infections low, but does not see us spend too much time in strict lockdowns, is achievable when the infection rate of the virus is low to medium (i.e. an infected person is roughly likely to infect between 2.5 and three others when there is no immunity) and the policy response is somewhere between moderate elimination and tight suppression.
But for a highly infectious variant, akin to the UK variant, the sweet spot of moderate elimination while keeping virus numbers reasonable could still see us spending more time in lockdown than we would like.
This points to the need to be cautious when it comes to opening up international borders until our vaccine coverage is high. It also reinforces the high desirability – necessity even – for Queensland to stamp out its current outbreak.
We encourage you to explore the scenarios using the COVID-19 Pandemic Trade-off web tool, and make your own interpretations.
As our knowledge improves – and as evidence emerges on vaccine coverage and effectiveness – we will continue to update this tool, and plan to build in new scenarios explicitly looking at future border policy options.
The COVID-19 Pandemic Trade-off tool was built with an anonymous philanthropic grant, through Advancement, that enabled this project.