Summary
The Program for International Student Achievement (PISA) 2022 results show Aotearoa New Zealand (NZ) students’ maths, science and reading proficiency levels have dropped since 2018, and this is partially explained by the number of students coming to school hungry. For the first time, the PISA study included measures of food poverty, with NZ ranking second worst in the OECD for number of students missing meals due to lack of money.
Achievement for students in food poverty was up to four years behind their food-secure peers, even after accounting for socioeconomic deprivation.
With the biggest increase in food insecurity for children in NZ in a decade observed in 2022/23, we need more measures to alleviate food poverty. Ka Ora, Ka Ako assists partially by providing nutritious lunches in one-quarter of schools, but, with rising food insecurity, it is not reaching enough students and achievement is falling behind.
In his recent State of the Nation address, Prime Minister Christopher Luxon lamented our educational results, noting that over the last two decades, maths achievement for 15-year-olds had dropped from fourth in the OECD to 19th.1 This rank comes from the Program for International Student Assessment (PISA) 2022 results that saw a large global drop in achievement, as well as a decline for New Zealand (NZ) students, particularly in mathematics.2
But what’s behind this decline in achievement?
For the first time, PISA 2022 student wellbeing data included data on how many teenagers went hungry due to a lack of money for food, allowing us to examine the impact this has on their school achievement.
Of the 25 OECD countries who provided data on food poverty, NZ had the second highest rate of students who, in the previous 30 days, had missed a meal at least once a week because there was not enough money to buy food (14.1%). This was well above the OECD average of 8.2% and was similar to rates of food poverty in Colombia and Chile.3 We had the third highest rate of students in severe food poverty, with 6.5% of students saying they missed meals more than 4 times a week. Only students in Chile (6.9%) and the United States (7%) had higher rates.
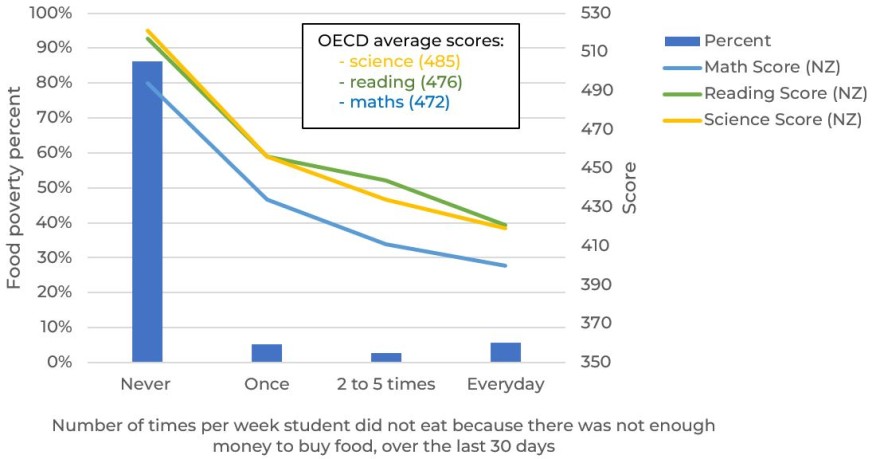
In addition to these poor international rankings for teenage food poverty in Aotearoa, an alarming associated lag in academic achievement was found. Students who missed meals even just once a week scored much lower than their peers who never went hungry. For example, in maths, the achievement lag was 60 points for students who miss meals about once a week; 83 points for students who miss meals 2 to 3 times a week and 94 points for students who miss meals every day or almost every day (Figure 1 and Appendix). To put this achievement gap into perspective, twenty points on the PISA scale is regarded as approximately equivalent to an average year of learning for 15-year-olds.3,4
Figure 1. Proportions of 15-year-olds in NZ in food poverty and associated PISA maths, reading and science achievement. *Categories “2-3 times per week” and “4-5 times per week” have been combined in this graph due to lack of numbers in the 4-5 times per week category for NZ students.
Multiple regression analysis shows the effect of food poverty remains large even when socioeconomic deprivation was held constant (Table in Appendix). Students in NZ who miss meals due to lack of money are 2 to 4 years behind in maths, reading and science achievement, compared to their peers who never miss meals, even after socioeconomic deprivation is taken into account.
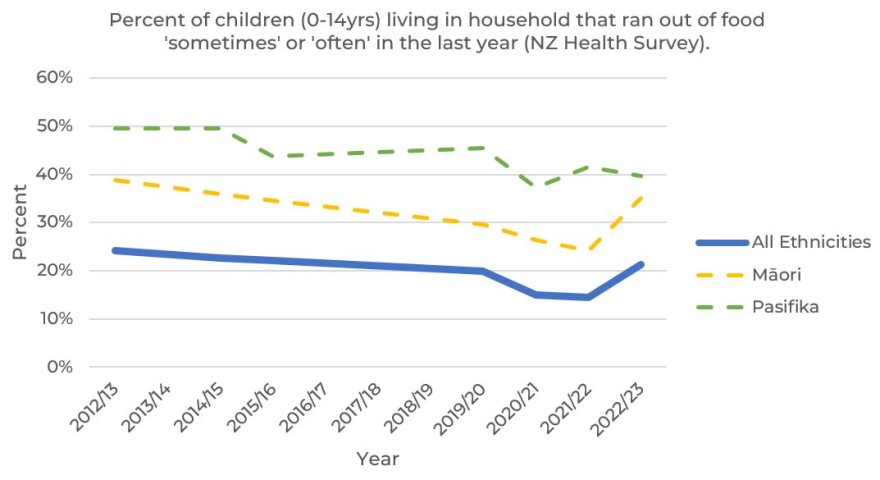
Furthermore, the 2022/23 NZ Health Survey revealed the largest jump on record for children living in food insecure households. Between 2021/22 and 2022/23, the proportion of children living in households where the food runs out sometimes or often jumped from 14.4% to 21.3%. For tamariki Māori, the already high proportion, rocketed a further 11 percentage points from 24.1% to 35.1%.5 In 2022/23, a decade of progress in reducing child food insecurity was reversed, in a trends graph that looks remarkably like a hungry hand held out for food (Figure 2).
Figure 2. Trends in number of children living in households that run out of food sometimes or often in the last year (NZ Health Survey)
One effective intervention and a major safety net against food poverty for students is the Ka Ora, Ka Ako school lunch programme offered to 230,000 students in around 25% of the least advantaged schools nationally.6 PISA data reveal that there are much higher rates of food poverty for 15-year-olds in these schools (26% vs. 11% in schools not receiving the lunches). However, the majority (60%) of 15-year-olds in food poverty do not attend Ka Ora, Ka Ako schools and miss out on the programme.
The new Government is seeking evidence-based interventions to improve academic achievement and reduce food poverty. This latest PISA data show how these challenges are linked, adding to the growing body of studies demonstrating the significant negative effect hunger has on academic achievement.7,8 Further efforts to alleviate hunger in schools (including both breakfasts and lunches) and remove this barrier to learning are required, with Health Coalition Aotearoa calling for the number of schools receiving Ka Ora, Ka Ako to be doubled9 to ensure that more students receive its nutritional, educational and economic benefits.
Alleviating student hunger would not only be a major step to improving overall academic achievement in NZ, it will also improve our poor track record in socio-economic fairness in education, compared to our OECD counterparts.3 Achieving greater equity in education is not only a social justice imperative, but, in the long term, it will mean fewer resources will be needed to deal with the consequences of low educational attainment, increase the supply of skills to fuel economic productivity, and promote social cohesion. Or as the International PISA report concludes, “Not least, how we treat the most vulnerable students and citizens shows who we are as a society”.
What’s new in this briefing:
- For the first time, the Program for International Student Assessment (PISA) included food poverty measures and this is strongly associated with poorer school achievement, even after taking socioeconomic deprivation into account.
- The recent large rise in food insecurity for children in NZ reverses the downwards trend of the last decade.
Implications for public policy
- Hunger is major threat to public health and educational attainment and needs to be urgently addressed.
- The majority of food-insecure students attend schools not eligible for Ka Ora, Ka Ako, so the programme needs to be expanded.
- Additional strategies to reduce food poverty also need to be considered (for example, reducing unemployment, improving benefit levels for low advantage populations, and greater support for community food resiliency initiatives).
Author details
Dr Pippa McKelvie Sebileau, Te Kura i Awarua, Eastern Institute of Technology, Napier
Prof Boyd Swinburn, School of Population Health, University of Auckland
Authors declare no competing interests.
Acknowledgments
We are grateful to the Educational Measurement and Assessment team within the Ministry of Education for their analysis of the PISA data and to Renee Railton and D’Acy Searchfield from the Nourishing HB: He Wairua tō te kai team for their support.
Appendix
Table A1. Differences in achievement scores based on food poverty category.
Analysis generated using the PISA International Data Explorer. Extracted from the PISA International Data Explorer (via National Centre for Education Statistics and OECD). Columns show mean difference in achievement scores between students reporting missing meals 'Never or almost never' and other categories (standard error shown in brackets).
| Food poverty | Mathematics scale | Reading scale | Science scale |
| About once a week | -60 (6.3) | -61 (7.9) | -65 (7.8) |
| 2 to 3 times a week | -83 (10.3) | -72 (11.8) | -86 (11.3) |
| 4 to 5 times a week* | - | - | - |
| Every day or almost every day | -94 (6.6) | -96 (7.7) | -102 (7.3) |
All differences are statistically significant at p < .001.
*A significance test could not be performed because reporting standards were not met, or appropriate standard errors could not be calculated for one or more estimates in the test.
Table A2. Regression analysis adjusting for socioeconomic deprivation
A linear regression model was used to estimate the effect that food insecurity (once a week, 2-3 times a week, 4-5 times a week and every or almost every day, reference: never) had on the student’s mean PISA maths score, holding the student’s level of socioeconomic deprivation constant (PISA economic, social and cultural status (ESCS) variable). Created using the PISA SAS macro.
| Variable | Estimate | Standard error | t value |
| Intercept | 482.35 | 1.72 | 279.44 |
| Socioeconomic deprivation - ESCS | 37.66 | 1.95 | 19.25 |
| Food insecurity once a week | -37.72 | 6.14 | -6.13 |
| Food insecurity 2-3 times a week | -56.35 | 10.65 | -5.28 |
| Food insecurity 4-5 times a week* | -91.90 | 15.62 | -5.88 |
| Food insecurity every or almost every day | -76.27 | 6.27 | -12.14 |
*Note limited number of students in this category in NZ