Summary
Alcohol is New Zealand’s most harmful drug, costing society more than $9 billion a year. Restricting alcohol availability is proven to reduce harm, but that requires data on who is selling alcohol and where.
The Alcohol Regulatory and Licensing Authority Register (ARLA) is the only nationwide source of this data, yet comparison with council records shows major discrepancies. The latest figures show ARLA’s database undercounted on-licences by 13% (1,097 venues) and off-licences by 15% (587 outlets) compared to council registers, with some areas missing up to 100% of premises, while overcounting others by up to 88%.
The poor quality of national data on alcohol availability undermines research, public health monitoring, and community input into licensing decisions. This Briefing recommends stronger enforcement of council reporting, increased licensing fees to fund compliance, requiring reporting to be submitted by a set date, and implementing a data standard for councils that would improve the standardisation and accuracy of licence details across the country. With these improvements, the ARLA Register would provide a more reliable picture of alcohol availability nationwide.
Alcohol availability
Alcohol is Aotearoa New Zealand’s (NZ) most harmful drug.1 It causes more death and disability among New Zealanders aged 15-49 years than any other unhealthy behaviour, including smoking.2 More harm is caused to other people than to the drinker,3 with a total cost to society estimated at $9.1 billion dollars annually.4
Restricting the availability of alcohol is one of the most effective ways to reduce alcohol harm.5 There is good evidence that higher alcohol outlet density is linked with increased rates of self-harm,6 hazardous and binge drinking,7–10 crime,9,11 including serious violent crime,12 property damage, police events and motor vehicle accidents.13
Timely and accurate information on alcohol availability is vital to inform local and national action to reduce the burden of alcohol harm. Reliable data enables agencies to report on licence applications and helps communities to compare their local area with others, have a say on local alcohol policies, and hold the Crown to account for their obligations under Te Tiriti.
The ARLA data
In NZ, information on alcohol outlets is recorded and maintained by the Alcohol Regulatory and Licensing Authority (ARLA) through their Register of Licences and Certificates. The Register is based on information from local councils, who are required by law to provide licence details to the Ministry of Justice. It is the only national source of information on the number of licences, their locations, and licence conditions.
Licence types
- On-licences are for restaurants, bars, clubs and other venues selling alcohol to be consumed onsite
- Off-licence outlets include bottle stores and supermarkets that sell takeaway alcohol.
Experts in alcohol harm prevention have known there to be issues with the quality of the ARLA data. In this Briefing, we expose issues with the quality of data in the ARLA Register and suggest mechanisms for improvement. The issue with the ARLA data is a simple one of ‘bad data in, bad data out’; that is, information provided by many councils is sporadic, out-of-date, and has missing fields, if it is even provided at all.
Inaccuracies in the ARLA Register
We compared ARLA Register counts of on- and off-licensed premises with up-to-date information provided by individual councils obtained under the Local Government Official Information and Meetings Act (LGOIMA).
These datasets referred to broadly the same time periods (February 2025 compared with December 2024), so we would expect them to show similar numbers of alcohol outlets for each of the 67 councils. They didn’t. Nationally, the ARLA Register undercounted 13% of on-licence and 15% off-licence outlets.
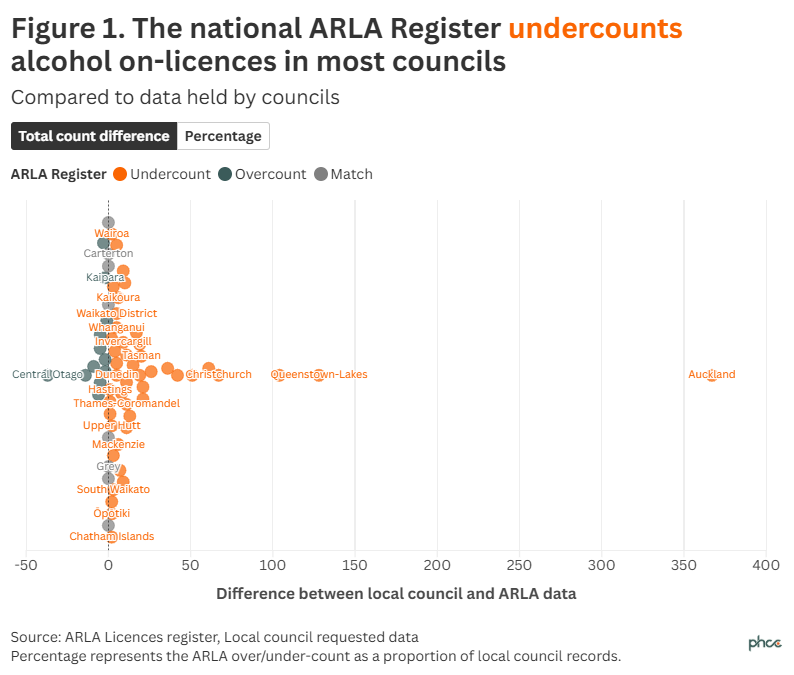
On-licences
There was a large mismatch between the number of on-licences according to the ARLA Register (7,077 licences) and council records (8,174 licences). Nationwide, the ARLA Register had a major undercount of 1,097 on-licences compared with council records (a 13% shortfall).
- For most councils, the ARLA Register undercounted on-licences. The largest undercounts were in Auckland (367 on-licences), Queenstown-Lakes (128 on-licences), and Tauranga (104 on-licences).
- None of the on-licences in Gore or the Chatham Islands were recorded in the ARLA Register.
- Conversely, for 12 councils, the ARLA Register overcounted the number of on-licences.
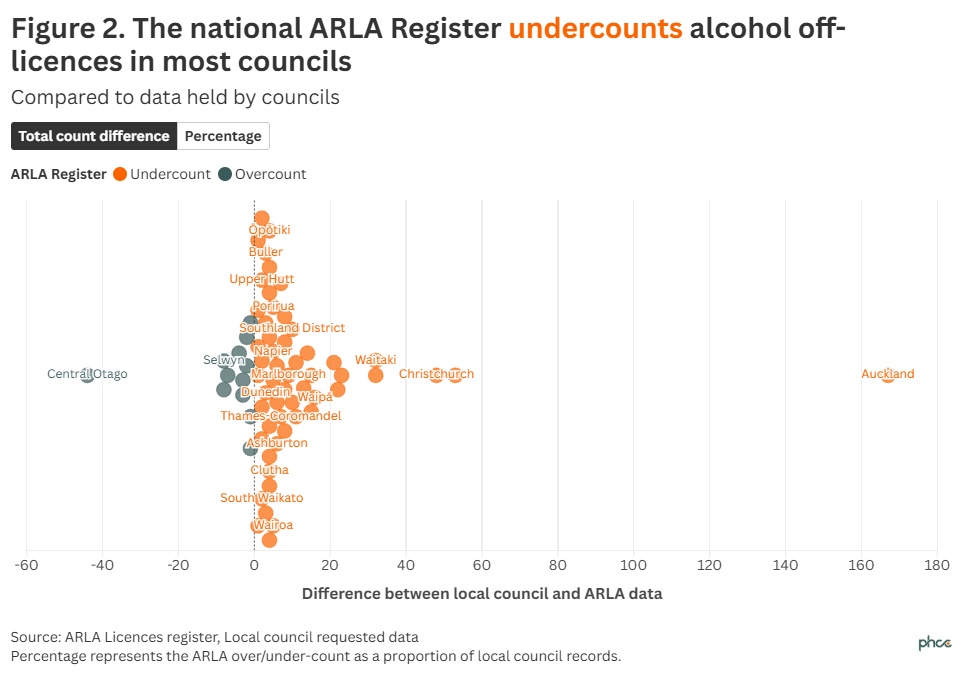
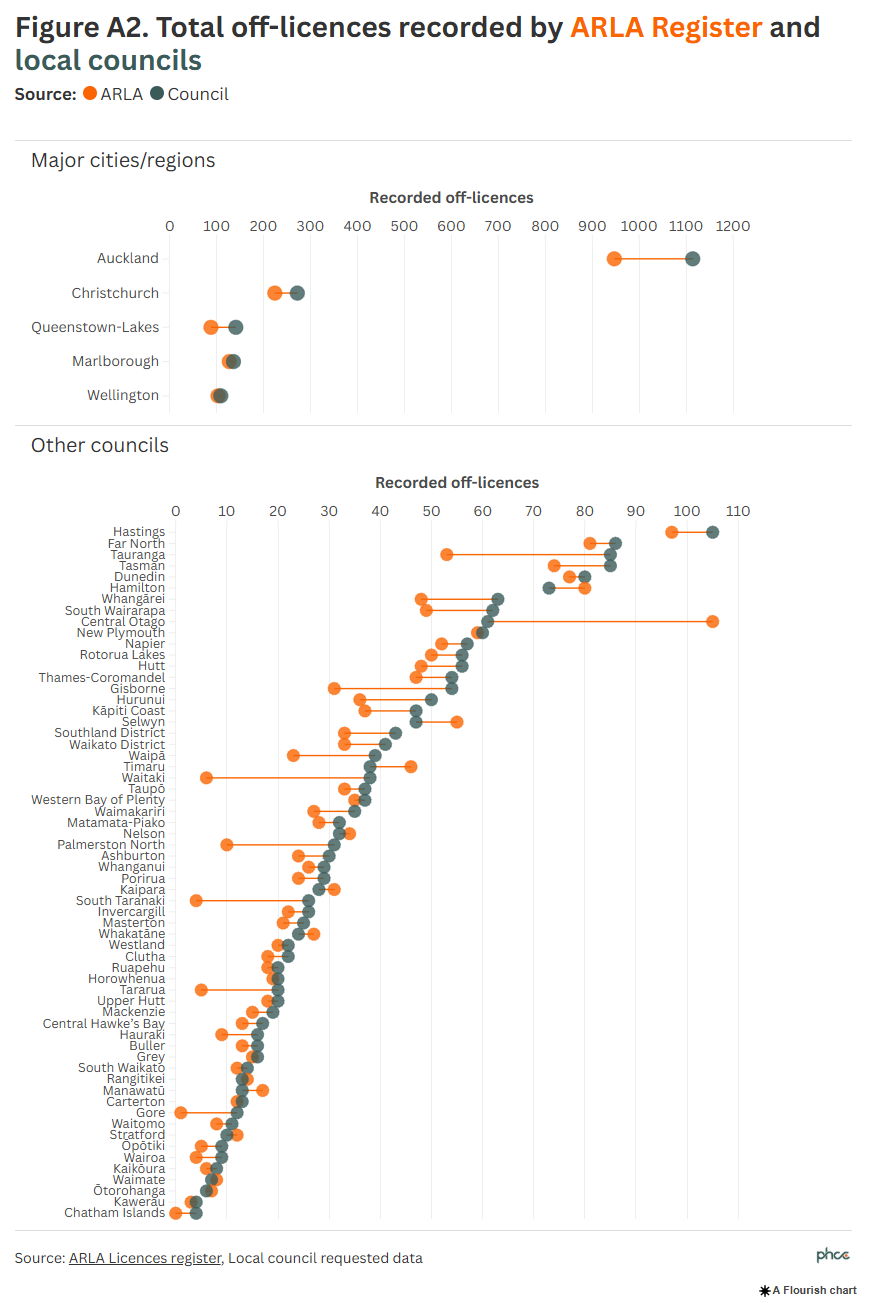
Off-licences
There were also major differences in the numbers of off-licence outlets according to the ARLA Register (3,327 outlets) and council records (3,914 outlets).
Nationally, the ARLA Register had a large undercount of 587 off-licence outlets compared with council records (a 15% shortfall).
For most councils, the ARLA Register undercounted off-licences. The largest undercount was in Auckland (167 fewer licences recorded in the ARLA Register than in council records, a 15% shortfall).
- In several smaller councils (South Taranaki, Tararua, Waitaki, Gore), the ARLA Register massively undercounted, with less than a quarter of off-licences included in the ARLA Register.
- For 12 councils, the ARLA Register overcounted the number of off-licences.
Comprehensive figures comparing records for each council and a discussion of limitations can be found in the Appendix.
Implications for public health
Our analysis show that national-level data on alcohol outlets from the ARLA Register is inadequate and does not represent the true picture of alcohol availability in NZ.
Without complete and accurate data on the location of alcohol outlets nationally, we cannot reliably track patterns of availability or target resourcing and support to the areas with highest need. It also hampers our ability to assess links between access to alcohol outlets and other harms such as alcohol-related hospitalisations and crime. For example, a Manukau study using council records found that each additional off-licence is associated with an increase of 85.4 police events annually.13 Conducting similar research across the country is nearly impossible without reliable licence data.
Differences between the ARLA Register and council data vary across the country, with some councils having an undercount, and others an overcount. This means that any analyses using the ARLA Register are likely to be biased, giving a misleading picture of differences in alcohol availability. For many councils, using the ARLA Register would lead to a large underestimate of the extent of alcohol availability in their local community.
Strategies for responding
We recommend the following changes to improve the quality of the ARLA Register (more detail in Appendix):
- Improved enforcement of reporting by Ministry of Justice
- Increased resources for councils to improve reporting through an increase in licensing fees
- Requirement for councils to submit accurate, up-to-date licence details by a set annual date so the ARLA Register provides a transparent, nationwide snapshot
- ARLA to issue a data standard for licencing information that mandates a specific format for all licence data, including address information, licenced hours and days of operation.
What this Briefing adds
- New data highlights substantial data quality issues with the publicly-available Government database on alcohol licences (ARLA Register). This is the only nationwide source of alcohol outlet data in New Zealand.
- The ARLA Register is under-reporting licences in some areas by up to 100%, and over-reporting licences in other areas by up to 88%.
- The implications for researchers and communities in NZ are explained, along with possible solutions.
Implications for policy and practice
- Data quality issues with the ARLA Register mean that monitoring and research on alcohol availability may be biased and inaccurate.
- Our study suggests therefore that the ARLA Register is not fit for monitoring or research purposes.
- The Ministry of Justice, as well as local councils, have a part to play in ensuring that councils (a) fulfil their requirement to report their alcohol outlet data, and (b) have appropriate resources and capability for them to do so.
Addendum
The authors would like to acknowledge that Community Law has previously reported a discrepancy between the licence counts in ARLA and Council data in a written submission (see page 19) and presentation to the Justice Select Committee and a presentation to Te Whatu Ora/Health New Zealand. (added 22 September 2025).
Authors details
Sarah Sneyd, Alcohol Healthwatch
Lauryn Ah Mu, Faculty of Medical and Health Sciences, University of Auckland | Waipapa Taumata Rau
Dr Anja Mizdrak Department of Public Health, University of Otago Wellington | Ōtākou Whakaihu Waka, Pōneke
Kylie Mason Environmental Health Intelligence NZ, Massey University | Te Kunenga ki Pūrehuroa
Professor Michael Cameron School of Accounting, Finance, and Economic, University of Waikato | Te Whare Wānanga o Waikato
Appendix
Strategies for responding—further detail on recommendations
- Improved enforcement of reporting by Ministry of Justice
We recommend that the Ministry of Justice improves the enforcement of accurate reporting by councils. For example, they could consider changes to the Sale and Supply of Alcohol Act to specify enforcement mechanisms for councils. Currently, councils make an annual report to ARLA under Section 199 of the Act, and ARLA requests that the annual report includes a complete list of the names, addresses, and types of licensed premises. However, it is clear that many councils do not accurately report this data to ARLA, and ARLA’s only recourse is to ‘name’ the non-compliant councils in ARLA’s annual report to the Minister. This is a very weak enforcement mechanism and is currently ineffective in ensuring consistent council compliance with reporting requirements.
- Increased resources for councils to improve reporting through an increase in licensing fees
Resource constraints are likely contributing to councils not meeting their statutory obligations. Increasing licensing fees could help councils to meet their reporting requirements. The Ministry of Justice should increase the default licensing application fees to allow for greater cost recovery at the next fees amendment review in 2027. Alternatively, local councils could develop fees bylaws to increase their licensing fees to encompass more of a cost recovery. For example, Porirua City Council are developing a staggered fees bylaw that bring their total cost recovery for alcohol licences up to 100% by Year 3.
- Requirement for councils to submit accurate, up-to-date licence details by a set annual date so the ARLA Register provides a transparent, nationwide snapshot
At present, there is no way to establish when licence information in ARLA was last checked or updated. The quarterly release of information may mislead users into believing that licence details were correct as of the release date. At minimum, each record should be labelled with the date it was last added and/or reviewed. This would increase transparency and make it obvious which councils are fulfilling their statutory obligations to report to ARLA. We recommend that councils are required to report accurate licence details as at a set date (eg, 30th June) to enable the ARLA Register to be an accurate nationwide snapshot at a single time point each year.
- ARLA to issue a data standard for licencing information that mandates a specific format for all licence data, including address information, licenced hours and days of operation.
Currently, the address data on the ARLA Register is of poor quality (eg missing street numbers, varying formats), which limits the ability to place (‘geocode’) the alcohol outlets accurately on a map. A standardised data standard, including address data as well as improved accuracy in other details (such as licence type, licenced hours and days of operation), would be a major improvement to the ARLA dataset. This could potentially be achieved by linking outlets to Stats NZ’s new Statistical Location Register.
Specific improvements to the licence data in the ARLA Register include:
- Premise address and geolocation
- Consistency in format of licence conditions (including permitted opening hours)
- Contact details for licence holders
- Requirement for Premises Name to match actual trading name or an additional trading name field to be added.
Limitations
Our analysis shows the differences at only one point in time – the differences may be larger or smaller at different points in time. Second, our LGOIMA requests were only for overall licence counts (by on-licence and off-licence). This means we cannot provide a more granular breakdown by licence type or location, or examine which particular outlets are missing from the ARLA Register.
Additional figures comparing alcohol licence records
Correction note: This Briefing was updated on 4th September 2025 to correct the mislabelling of several councils in figures that occurred during the production process. None of the core results were changed.