The NZ Government must do more to clearly articulate its COVID-19 strategy: eradication or ‘flattening the curve’ mitigation. But to do so means understanding the maths and ethics of both these strategies. In this blog we adapt our work for Australia (just published in this blog) to the NZ setting.
The NZ Government is rapidly ratcheting up its control measures to deal with the threat of the COVID-19 pandemic. But in our view at least, there is still insufficient clarity about what strategy it is taking. Is it going for eradication (as was the successful goal for the SARS pandemic and seems to have been achieved in China for COVID-19), or is it going for ‘flattening the curve’ (mitigation) as per the traditional approach with influenza pandemics?
Similarly, in an excellent piece published in The Conversation by Prof John Daley of the Grattan Institute, he argues that there is a need in Australia for a better articulation of the country’s endgame strategy.
Is it:
- Audacious and ‘go for broke’. This means a nearly complete societal lockdown and very vigorous containment (as we’ve seen in Wuhan), with the aim of eradicating the virus from Australia within two to three months. Then keep the borders completely locked until a vaccine is available. What Daley calls Endgame C, the ‘stop then restart’.
- Or is it ‘flattening the curve’, which aims to reduce harm from the epidemic while slowly building up herd immunity. Daley calls this Endgame A. And it appears this is what most countries are pursuing – but often without clear articulation.
Daley also offers a third option, Endgame B, to tracing and tracking every infection, but we think of this as part of the toolkit for Endgames A and C.
We need to protect our older people and people with chronic disease from coronavirus, but there’s the other side of the coin that we don’t really like talking about.
If we are flattening the epidemic curve, we need our young and healthy citizens keeping critical parts of the economy going and being infected at higher rates to build up herd immunity.
But is asking our fit and healthy younger citizens to do this fair? And what is the rationale?
It is a matter of great urgency that governments everywhere, including NZ, announce what their strategy is – are they having a crack at eradication with ‘stop then restart’ (with its attendant additional level of short-term social and economic disruption, but a flickering light at the end of the tunnel), or keep on ‘flattening the curve’.
But since any eradication strategy might not be adopted or might fail, we still need a good understanding of ‘flattening the curve’ as the comparator.
How many deaths might we have under flattening the curve?
COVID-19 has a reproduction number (R0) of about 2.5 in society functioning ‘normally’ – it is lowered by social distancing.
For the epidemic to peter out under ‘normal’ societal functioning requires that about 60% of people are infected and become immune (1 – 1/R0 = 60%). This is herd immunity – when a high enough percentage of the population is immune, due to either infection or vaccination, that reintroduction of the virus will not see it able to take hold.
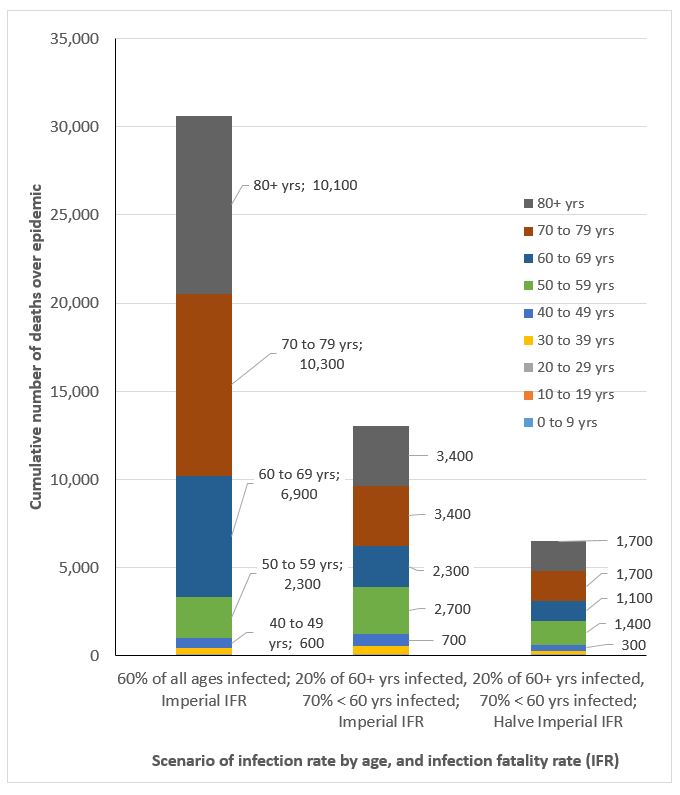
A recent study by Imperial College in the UK estimated that case fatality risk among those infected by age vary enormously from 0.002% among zero to 10 year’s old, up to 9.3% for people 80 years and over.
This is a pattern that is consistent with what was reported in a large Chinese study.
If by the epidemic’s end 60% of all age groups are infected, this is (a shocking) 30,600 deaths in NZ (Figure). (Other estimates in work the third author has done elsewhere give a lower total – but here to allow for comparisons with our work for Australia – we stick with the Imperial College estimates).
Figure 1: Deaths by age-group for three scenarios under ‘flattening the curve’ until 60% of the NZ population becomes immune from pandemic spread
Can we do better than this? Yes.
If we protect, which unfortunately also means ‘isolate’, people over 60 year’s old really well.
Let’s assume by epidemic’s end only 20% people over 60 have been infected. The corollary is that 70% of younger people need to become immune through infection to get the average infection rate to 60% to achieve herd immunity.
But this ‘simple’ measure has a profoundly beneficial effect, at least halving the total number of deaths to 13,000.
Why? Because the expected 27,300 deaths among the over 60’s are reduced to 9,100, with a compensatory increase from 3,300 to 3,900 deaths among younger people (<60 years).
Can we do better than this? Almost certainly.
Let’s assume that improving knowledge about treatments and improved healthcare organisation for people sick with COVID-19 leads to a 50% reduction in the case fatality risk among these sick people. This is speculative but a lot of re-organisation of healthcare systems is currently underway to improve managing COVID-19 cases which should see reductions in case fatality.
This results in a halving of the number of deaths to 6,500 – approaching the 5,000 deaths per year from tobacco use in NZ (although this only serves to remind us how disastrous the tobacco epidemic is, year in year out).
Can we do better still? Probably.
What has not been factored into the above calculations is that below the age of 60, the majority of deaths occur among people with chronic conditions like respiratory and heart disease.
If we wrap protection around these people as well as those over 60, the death rate will fall further – but again this will rely on other young healthy people having high infection rates and becoming immune.
Is specifically protecting the old (and people with chronic conditions) ethical from the perspective of the young and healthy who incur higher infection rates?
Under a health gain maximising utilitarian framework, yes. So long as the total life years saved by protecting the old and unwell exceed the life years lost among the increased numbers of young people dying – which it probably does. There are other ethical and philosophical analyses that could be made – the ‘fair innings’ argument for example which puts more weight on saving younger lives.
But if the NZ Government adopts the flattening the curve strategy it should probably mean we are then obligated to consider a societal contract.
If young (and healthy) people are expected to keep working and experience higher infections rates, the small proportion of those young people unfortunate enough to get very sick deserve prioritisation of critical care facilities over the elderly and people of all ages with chronic conditions.
Does this type of analysis help decision-making about the best endgame strategy for COVID-19 in NZ?
We hope so. Leaders in Wellington now have some (albeit crude) numbers to inject into this tough decision.
Let’s assume that a ‘stop then restart’ eradication strategy – if successful – still results in 500 deaths before eradication is achieved.
Assuming about five years of life lost per death (as they will mostly be in the elderly or those with chronic conditions), that is 2,500 life years lost.
Under the alternative ‘flattening the curve’ strategy there are perhaps 13,000 to 6,500 deaths, or 65,200 to 32,600 life years lost.
But we need to factor in the chance of success of an eradication policy. Let’s assume eradication has a three quarters (75%) chance of success in NZ at the current time, and therefore a 25% chance of failure or ‘defaulting back to flattening the curve’.
That means the expected life years lost under eradication = [75% × 2,500] + [25% × 65,200 to 25% × 32,600] = 10,000 to 18,200 ‘expected’ life years lost.
It is the difference (or what economists call the increment) between the scenarios of eradication and flattening the curve that really matters.
Combining worst- and best-case math, the expected gain for eradication over flattening the curve is therefore 14,400 life years saved (32,600 minus 18,200) to 55,200 life years saved (65,200 minus 10,000).
So these analyses suggest a strong extra health benefit of the eradication strategy over the ‘flatten the curve’ mitigation strategy. Indeed, this analysis is likely to be conservative as under the mitigation strategy the true case fatality risk might increase markedly once hospitals and ICUs in NZ are overloaded (and for a R0 = 2.5 pandemic in NZ this ICU overload occurs near the start of the epidemic curve).
How much do we spend to try and reap this expected gain?
Based on a rule of thumb in the BODE3 Programme we use GDP per capita as the threshold for cost-effectiveness around saving a year of life (ie, around $NZ 45,000 per life year / QALY).
This implies that as a society, and considering all differences in costs between attempted eradication versus flattening the curve (eg, in the health sector, across the economy – and factoring in that eradiation may be better in some aspects through a more ‘normal’ economy in a few months time), society might be prepared to spend up to $650 million to $2.48 billion more to ‘give eradication a go’.
These are quick calculations. There are many other considerations too, like allowing mathematically for morbidity and the capacity of the system. Our calculations could and should be improved.
The Government needs to instruct the Ministry of Health and Treasury to check and update our analysis. It is running out of time to get this sorted.