Summary
New Zealand Health Survey (NZHS) data for 2024/2025 were released on 19 November 2025. There were substantial reductions in daily smoking rates between 2011/12 and 2022/23 (from 16.4% to 6.8%). For the first time since the NZHS started, daily smoking prevalence remained virtually unchanged for three consecutive years, sitting at between 6.8% and 6.9% in 2022/23, 2023/24, and 2024/25.
Large inequities in smoking prevalence persist, with prevalence substantially higher among Māori, Pacific peoples, and people experiencing higher levels of neighbourhood deprivation.
There also appears to be a growing gap in smoking prevalence between men and women.
These findings strongly suggest that the government’s Smokefree 2025 Goal (daily smoking prevalence of less than 5% for all population groups by the end of 2025) will not be achieved.
This Briefing summarises key findings on smoking prevalence from the 2024/25 New Zealand Health Survey (NZHS). Findings are considered in relation to the Aotearoa New Zealand Government’s 2025 Smokefree Goal to reduce daily smoking prevalence to less than 5% for all population groups by the end of 2025.1
The NZHS is an annual nationally representative population survey that has run since 2011/12. In 2024/25, the adult survey included a total of 9,253 New Zealanders aged 15 years and older (full details of the methods and data are available on the Ministry of Health website).
Data include 95% confidence intervals (95% CI), which indicate the uncertainty in an estimate. (See Appendix 2 for more details)
Overall smoking prevalence trends
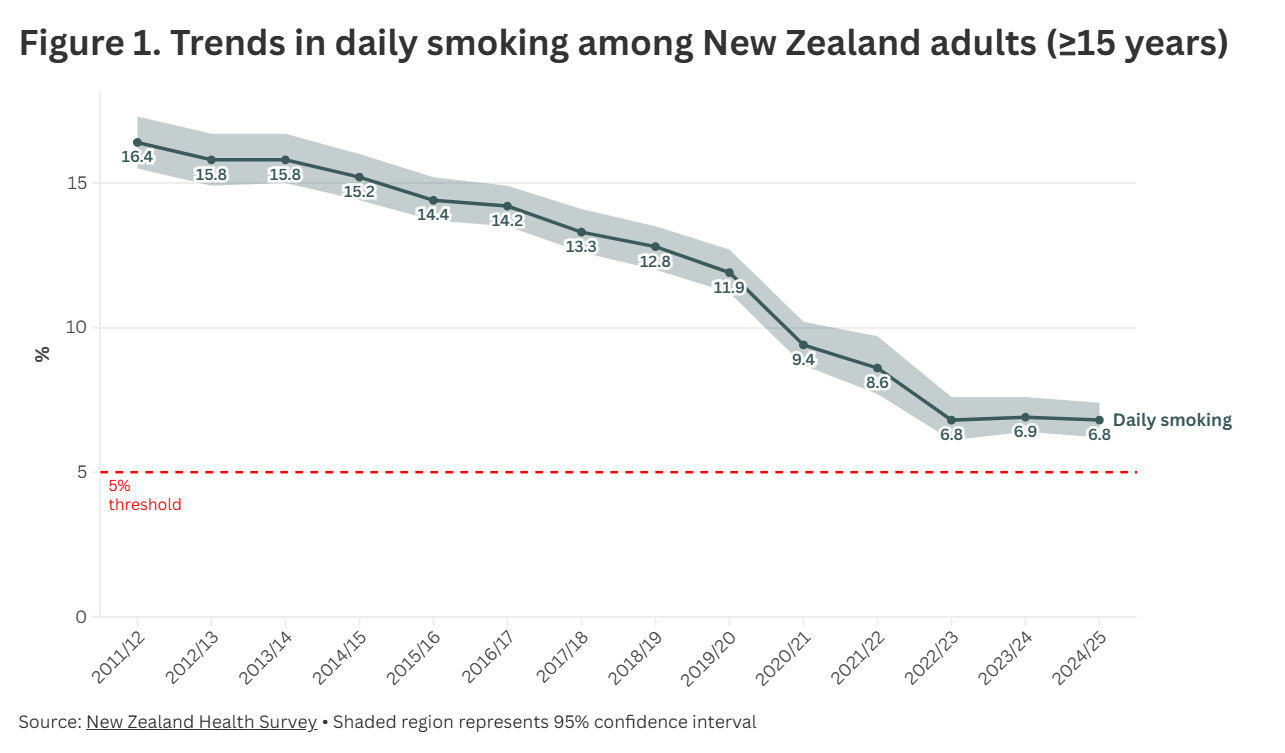
Daily smoking (defined as a survey participant smoking daily and having smoked more than 100 cigarettes in their lifetime) prevalence in 2024/25 was 6.8% (95% CI: 6.2-7.4%), which is an estimated 294,000 people (Figure 1).
Between 2011/12 and 2022/23 daily smoking reduced from 16.4% to 6.8%. After that, and for the first time since the NZHS started, daily smoking rates remained the same (within 0.1%) for three consecutive years.
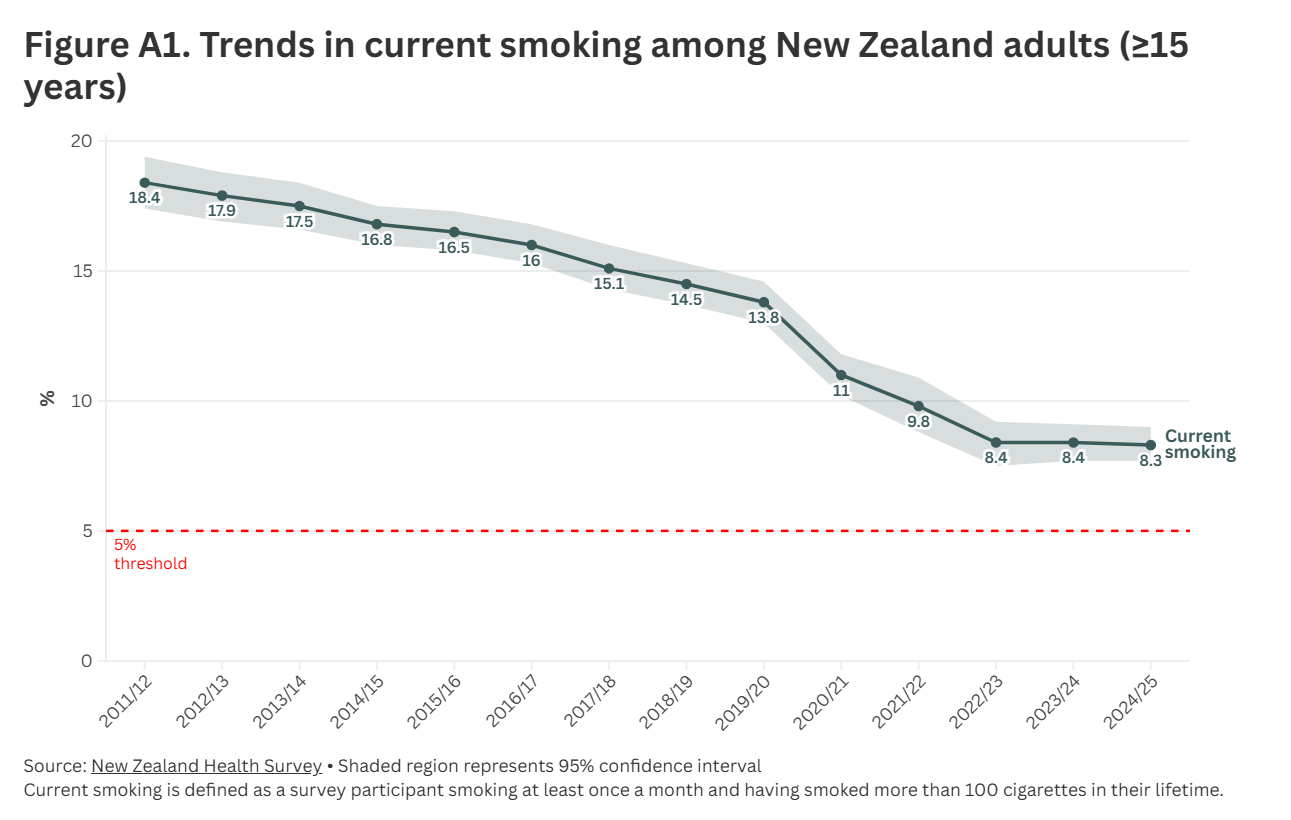
Current smoking (defined as a survey participant smoking at least once a month and having smoked more than 100 cigarettes in their lifetime) prevalence was 8.3% (95% CI: 7.7-9.0%), which is approximately 362,000 adults (see Appendix, Figure A1). Current smoking rates have remained at 8.3 to 8.4% for the last three years.
Smoking prevalence and trends by ethnicity
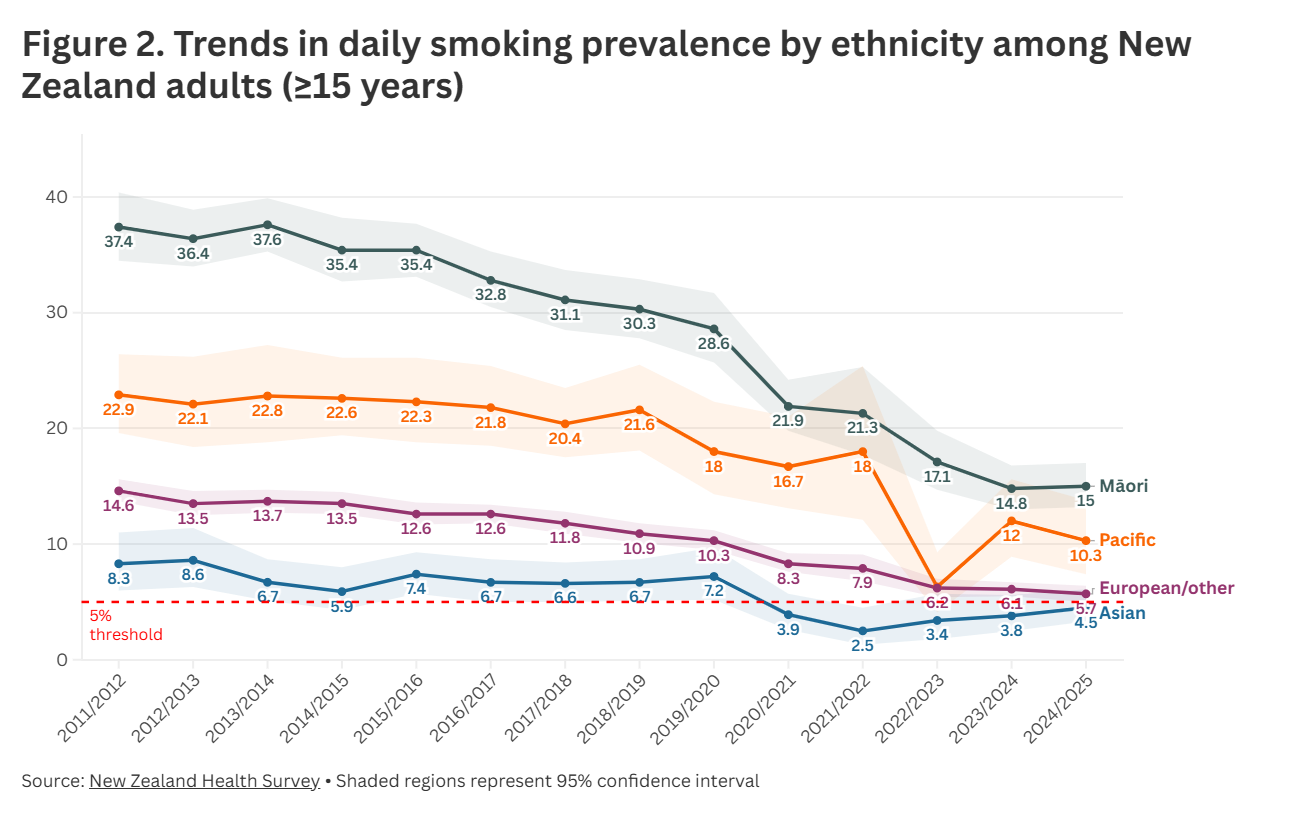
Substantial inequities in daily smoking by ethnicity persist (Figure 2) with Māori and Pacific smoking prevalence well above 5% in 2024/25.
Daily smoking prevalence shows an overall downward trend for Māori (to 15.0% (95% CI: 13.2-17.0) in 2024/25) and Pacific peoples (to 10.3% (95% CI: 7.4-13.8) in 2024/2025). However, prevalence among Māori did not decrease in 2024/25 compared to 2023/24. Daily smoking rates were substantially lower for the European/other (5.7% (95% CI: 5.0-6.4) in 2024/25) and Asian groups (4.5% (95%CI 3.3-6.1) in 2024/25).
Differences persisted when data were adjusted by age and gender (adjusted ratios 2.89 (95% CI 2.43-3.44) for Māori vs non-Māori and 1.62 (95% CI 1.17-2.25) for Pacific vs non-Pacific). (See Appendix 2 for details)
Smoking prevalence and trends by neighbourhood deprivation
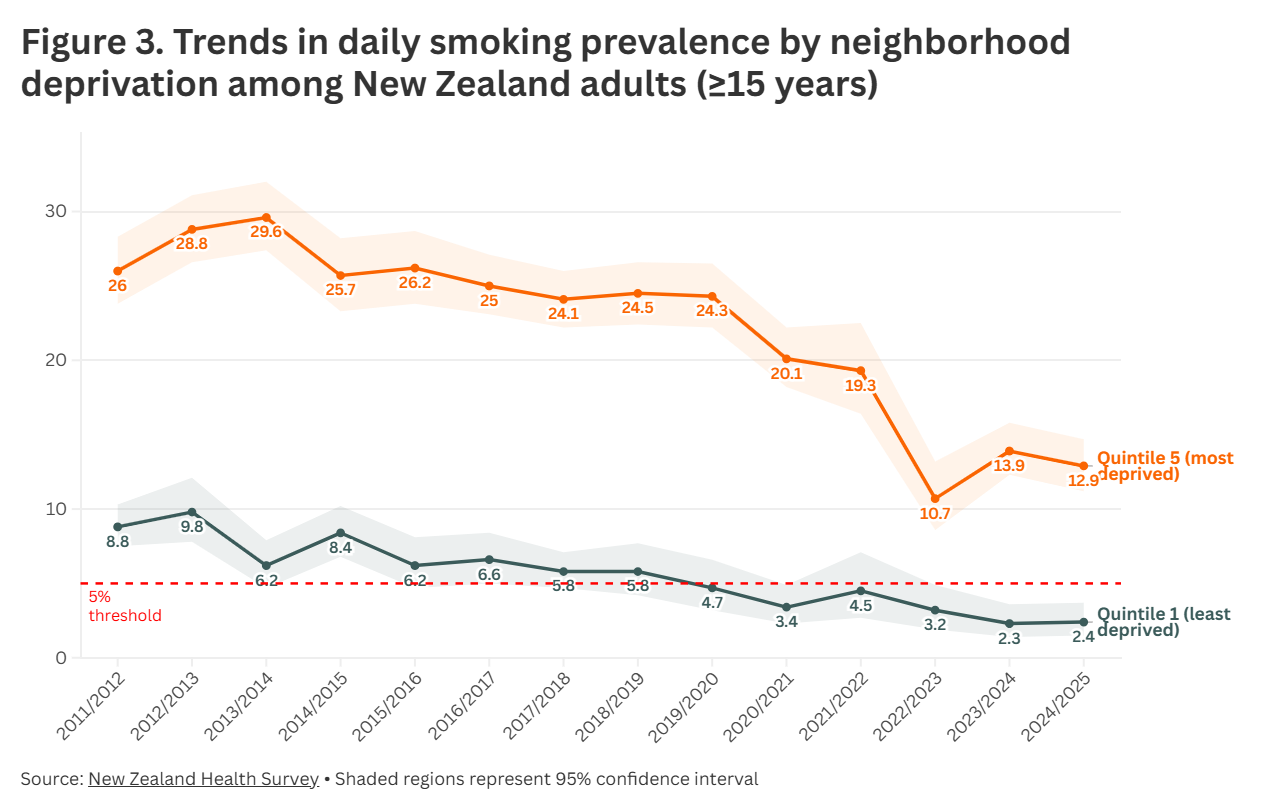
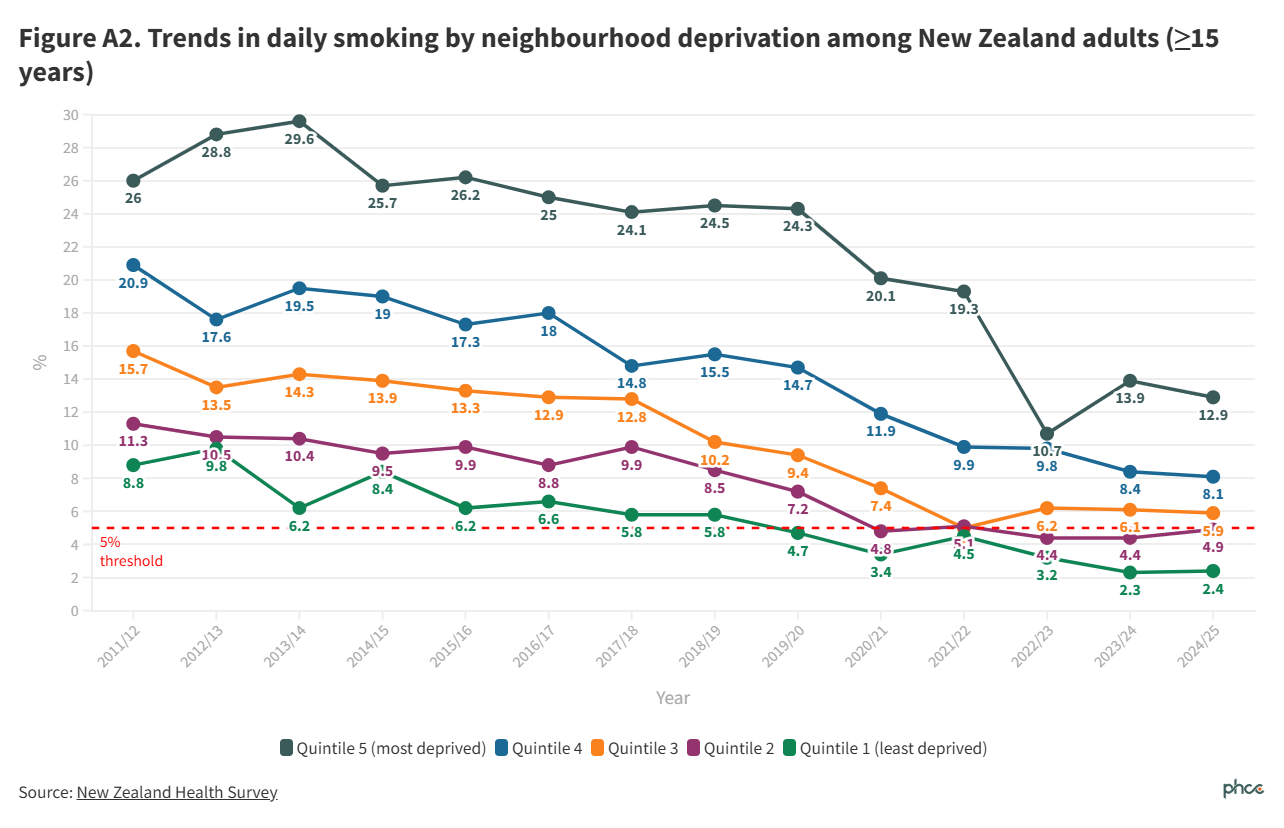
Inequities in daily smoking prevalence persist between the most and least deprived quintiles of neighbourhood deprivation (Figure 3; see Appendix -- Figure A2 for all quintiles; see Appendix 2 for more detail on deprivation index).
Quintiles 5 and 4 sat well above 5% daily prevalence in 2024/2025 at 12.9% (95% CI: 11.2-14.7) and 8.1% (95% CI: 6.8-9.5), respectively. Prevalences for quintiles 3, 2, and 1 were 5.9% (95% CI: 4.3-7.8), 4.9% (95% CI: 3.8-6.2), and 2.4 (95% CI: 1.5-3.7).
Differences persisted when data were adjusted by age, gender, and ethnicity (adjusted ratio for most deprived vs least deprived, 4.86 (95% CI: 3.32-7.11)). (See Appendix 2)
Smoking prevalence and trends by age group
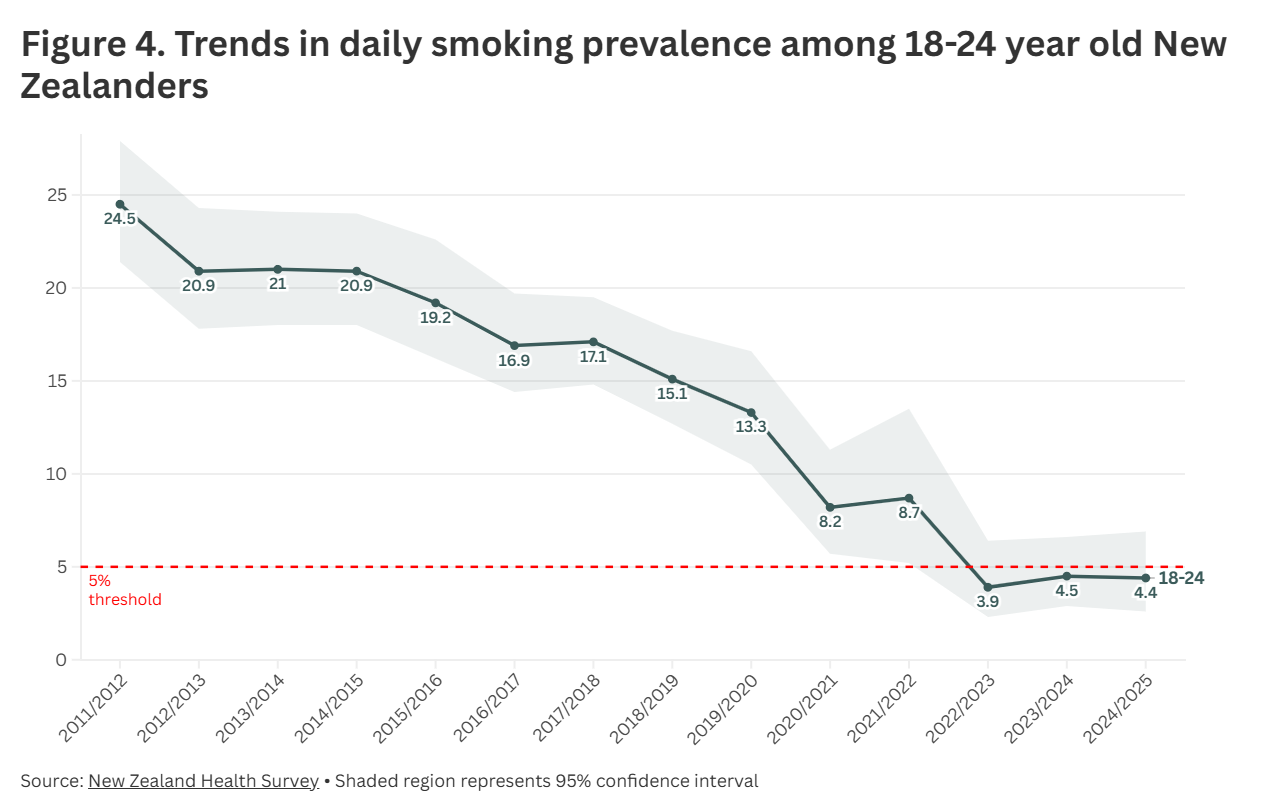
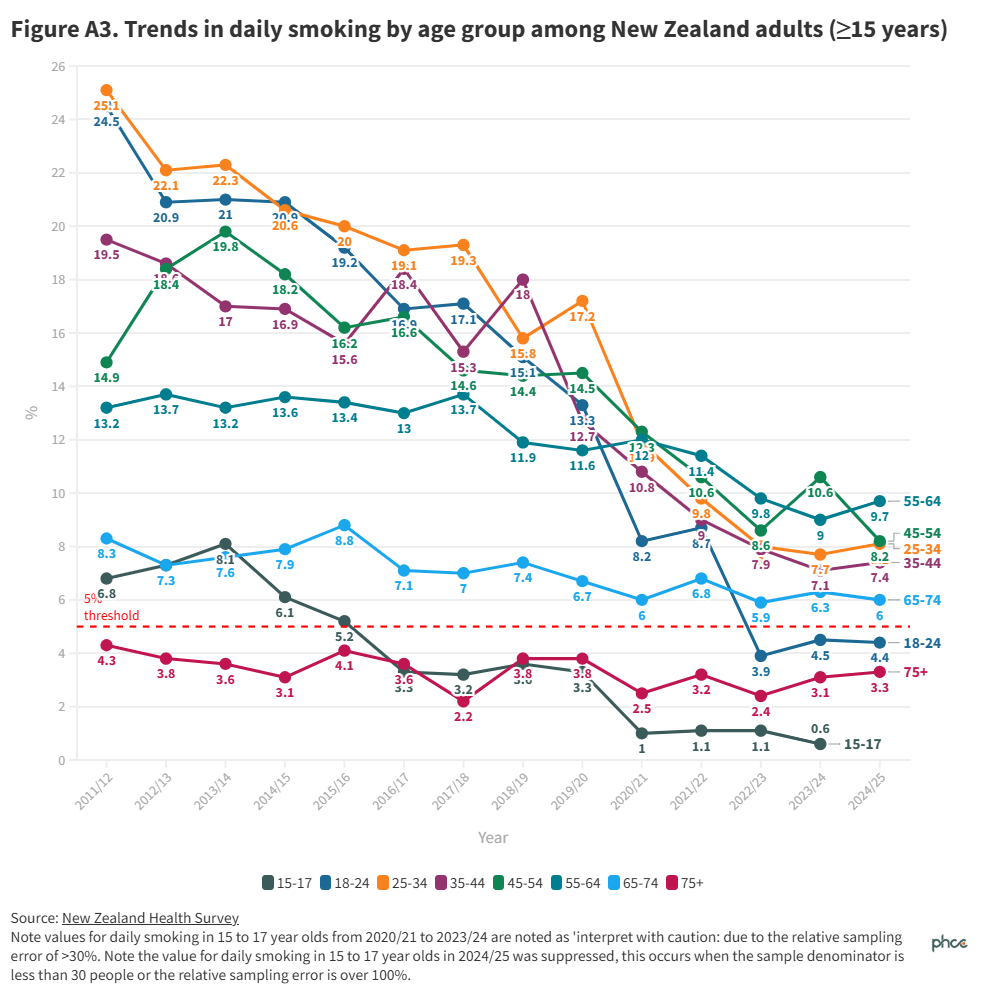
Daily smoking prevalence varied by age. People between 18 and 24 years of age had a daily smoking prevalence in 2024/25 of 4.4% (95% CI: 2.6-6.9). This age group had the greatest reduction in daily smoking prevalence between 2011/12 and 2022/23 (Figure 4), though prevalence did not decrease further between 2022/23 and 2024/25. See Appendix - Figure A3 for all age groups.
In the oldest age groups, people aged 75 and older had a daily smoking rate of 3.3% (95% CI: 2.1-4.9), for people aged 65 to 74 it was 6.0% (95% CI: 4.7-7.7) (Appendix 1- Figure A3). Prevalences sat between 7.4 and 9.7% for all other age groups (Appendix 1, Figure A3). Data for 15 to 17 year olds was supressed (Appendix - Figure A3).
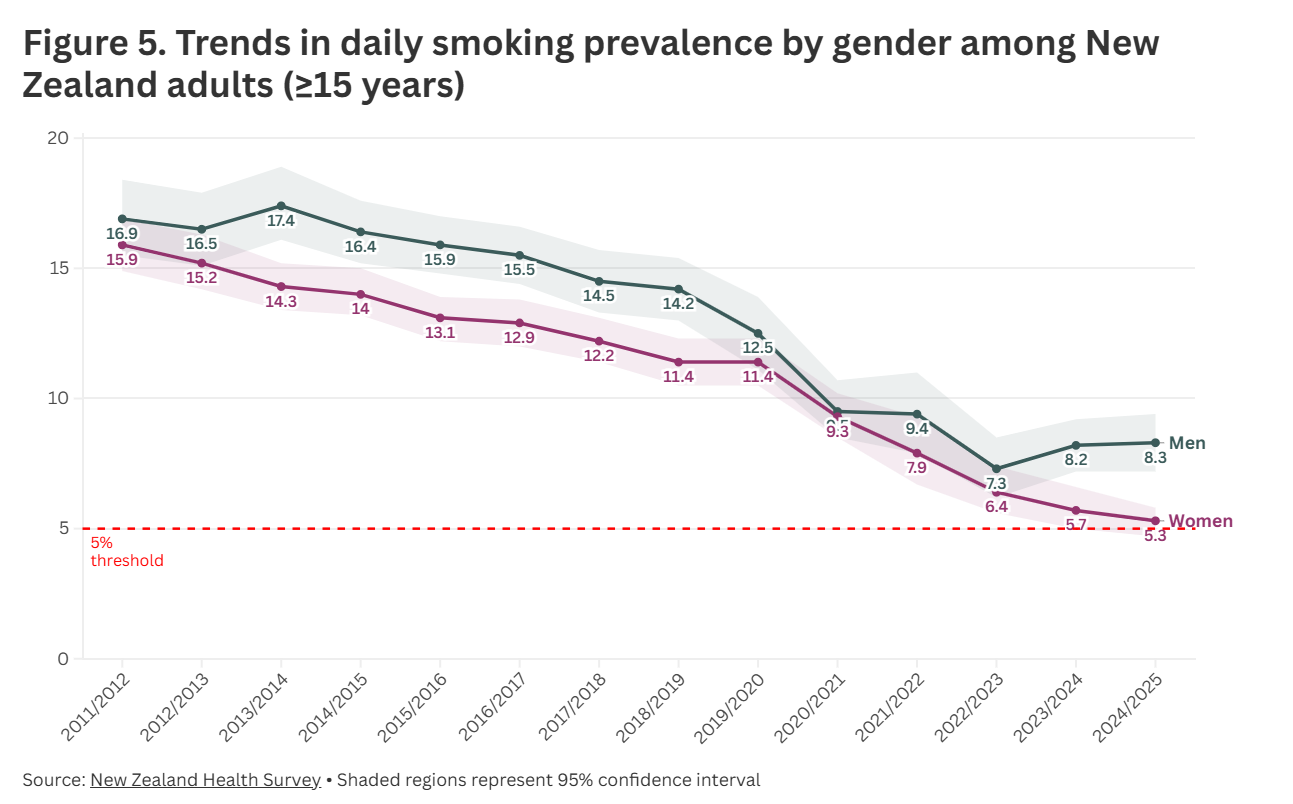
Smoking prevalence and trends by gender
In 2024/25, 5.3% (95% CI: 4.7-5.8) of women reported smoking daily (Figure 5). By contrast, 8.3% (95% CI: 7.2-9.4) of men reported smoking daily. This difference persisted when data were adjusted by age (adjusted ratio 1.57 (95% CI: 1.32-1.87)). (Appendix 2)
Conclusions
For the first time since the NZHS started, daily smoking prevalence remained virtually unchanged for three years in a row, sitting at between 6.8% to 6.9% in 2022/23, 2023/24, and 2024/25. These findings suggest that progress in reducing daily smoking prevalence has stalled. By contrast, daily smoking prevalence had steadily reduced between 2011/12 and 2022/23 (from 16.4% to 6.8%).
Additionally, large inequities persist, particularly among Māori and Pacific peoples, and by neighbourhood deprivation; with daily smoking prevalence well above 5% in these priority groups. It is likely that these inequities are due to greater exposure to known risk factors for smoking. Addressing these causes, including the nature and supply of tobacco, is likely to reduce inequities.
Daily smoking prevalence for people between 18 and 24 years of age was low at 4.4%. However, data by both age and ethnicity are not presented on the NZHS data explorer. Further analyses are needed to examine whether smoking rates are substantially higher for Māori and Pacific peoples in the 15- to 24-year-old age group.
There appears to be a growing gap in smoking prevalence between men and women, which will be important to monitor.
The latest survey data are from mid-2024 to mid-2025, meaning daily smoking rates by the end of 2025 remain to be seen. However, the 2024/25 NZHS findings strongly suggest that the government’s goal to reach a daily smoking prevalence of less than 5% for all population groups will not be achieved. Robust, effective, and equitable policies need to be implemented to rapidly reduce smoking prevalence for all population groups.
What this Briefing adds
- Between 2022/23 and 2024/25, daily smoking prevalence remained between 6.8 and 6.9%. This finding stands in stark contrast to the steady reductions made between 2011/12 and 2022/23.
- Substantial inequities in smoking persist; daily smoking prevalences were substantially higher for Māori (15.0%), Pacific peoples (10.3%), and those living in the most deprived neighbourhoods (12.9%).
Implications for policy and practice
- The findings suggest that the government’s Smokefree 2025 Goal will not be met and will be missed by a substantial margin for Māori and Pacific peoples, and people living in the most deprived neighbourhoods.
- Further public health measures are needed to ensure the goal is achieved equitably and quickly.
Authors details
Dr Janine Nip, ASPIRE Aotearoa Research Centre, and Department of Public Health, Ōtākou Whakaihu Waka | University of Otago
Prof Richard Edwards, ASPIRE Aotearoa Research Centre, and Head of Public Health of the College of Medicine & Public Health, Flinders University
Prof Janet Hoek, Co-Director of ASPIRE Aotearoa Research Centre, and Department of Public Health, Ōtākou Whakaihu Waka | University of Otago
Assoc Prof Andrew Waa, Co-Director of ASPIRE Aotearoa Research Centre, and Department of Public Health, Ōtākou Whakaihu Waka | University of Otago
Lani Teddy, ASPIRE Aotearoa Research Centre, and Department of Public Health, Ōtākou Whakaihu Waka | University of Otago
Appendix 1. Additional figures
Table A1. Daily smoking values showing percentage with 95% confidence intervals in brackets
| Demographic | 2024/25 Percentage (95% confidence interval) |
| Total | | 6.8 ( 6.2 - 7.4 ) |
| | | |
| Ethnicity | Māori | 15.0 ( 13.2 - 17.0 ) |
| | Pacific | 10.3 ( 7.4 - 13.8 ) |
| | Asian | 4.5 ( 3.3 - 6.1 ) |
| | European/Other | 5.7 ( 5.0 - 6.4 ) |
| Neighbourhood deprivation | Quintile 1 (least deprived) | 2.4 ( 1.5 - 3.7 ) |
| | Quintile 2 | 4.9 ( 3.8 - 6.2 ) |
| | Quintile 3 | 5.9 ( 4.3 - 7.8 ) |
| | Quintile 4 | 8.1 ( 6.8 - 9.5 ) |
| | Quintile 5 (most deprived) | 12.9 ( 11.2 - 14.7 ) |
| Age | 18-24 | 4.4 ( 2.6 - 6.9 ) |
| | 25-34 | 8.1 ( 6.4 - 10.0 ) |
| | 35-44 | 7.4 ( 5.8 - 9.3 ) |
| | 45-54 | 8.2 ( 6.8 - 9.8 ) |
| | 55-64 | 9.7 ( 8.0 - 11.6 ) |
| | 65-74 | 6.0 ( 4.7 - 7.7 ) |
| | 75+ | 3.3 ( 2.1 - 4.9 ) |
| Gender | Male | 8.3 ( 7.2 - 9.4 ) |
| | Female | 5.3 ( 4.7 - 5.8 ) |
Appendix 2. Additional details
1. Further detail on confidence intervals is in the NZHS methodology report. A summary of the 2024/25 data is in Appendix Table A1.
2. Adjusted ratios with adjustment variables are as presented on the Ministry of Health website. An adjusted ratio of above 1 indicates an outcome is more likely in a group of interest, for example, an adjusted ratio of 2 means an outcome is 2 times more likely in the group of interest.
3. In the NZHS, neighbourhood deprivation refers to the New Zealand Index of Deprivation 2018 (NZDep2018), which measures the level of socioeconomic deprivation for each neighbourhood (Statistical Area 1) according to a combination of the following 2018 Census variables: household income, benefit receipt, household crowding, home ownership, employment status, qualifications, single parent families, living in home with dampness/mould and access to the internet. Quintile 1 represents areas with the lowest level of deprivation and quintile 5 represents the highest level of deprivation. Further detail is available in the NZHS methodology report.