Summary
In this Briefing we report on carbon dioxide (CO2) levels in public transport settings in Aotearoa NZ as a proxy measure for poor ventilation and increased Covid-19 transmission risk. In buses and trains with more than 50% of seats occupied, ventilation was typically poor 94% and 77% of the time respectively (CO2 levels above 800 ppm). These and other NZ findings (eg, from a 2022 study of Wellington’s Metlink buses) are consistent with international research also showing poor ventilation in these settings. Fortunately, there are multiple actions that transport companies and central/local government can take to improve the situation – including adopting relevant standards. Such interventions may lower the risk of Covid-19 and other respiratory virus transmission and ensure staff occupational safety.
Appropriate ventilation is essential on public transport such as buses and trains to maintain good indoor air quality. Along with air filtration, this reduces the risk of spreading airborne pathogens1 and ensures a comfortable and healthy environment for passengers and staff. Ensuring good air quality is particularly important currently, given the continuing circulation of Covid-19 in Aotearoa NZ and the spread of winter-associated airborne infections such as influenza and RSV.
How we collected the data
We measured carbon dioxide levels (CO2 in parts per million [ppm]), as a proxy measure of ventilation quality and Covid-19 transmission risk.2 CO2 levels were recorded using Aranet4 monitors, typically on routine travel for work (ie, convenience sampling). Further details of the methods are in the Appendix.
Results
Data collection occurred on buses (30 trips, 3 cities) and trains (15 trips, 3 cities) during autumn (April, May) and winter (June) 2023.
Our results indicate that poor indoor air quality dominates in these settings (Table 1). In buses and trains with ≥50% of seats occupied, ventilation was poor (CO2 ≥800 ppm) 94% and 77% of the time respectively. Levels in the “high risk” category (≥1500 ppm) were recorded 49% of the time in buses with ≥50% of the seats occupied.
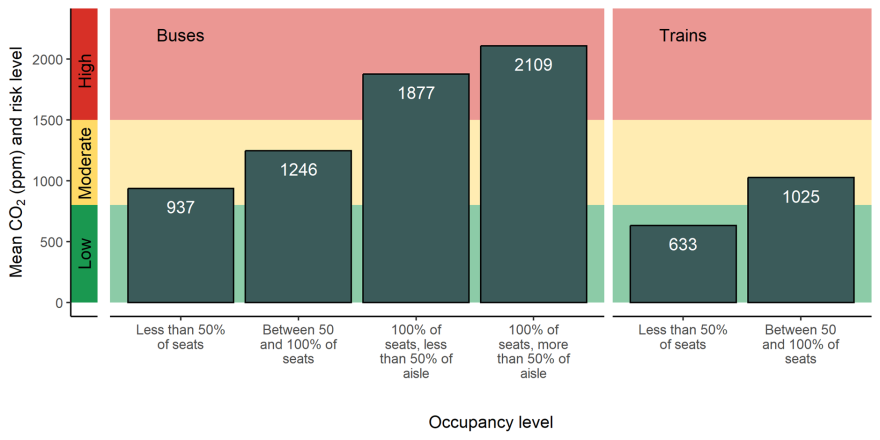
Levels of CO2 steadily rose with the level of occupancy (Figure) and the differences in average CO2 levels between occupancy levels was statistically significant (eg, comparing the average CO2 level between higher and lower occupancy bus groups [1600 vs 937 ppm] in Table 1, p < 0.0001).
For all settings the estimated passenger mask use was relatively low (range 2.6% to 10.6%, Table 1), albeit slightly higher in buses than trains (p = 0.0159).
Table 1: Carbon dioxide (CO2) levels (ppm) in sampled buses and trains used to assess ventilation quality, along with estimates of mask use by passengers.
| Public transportation mode and occupancy level | | % of time at relative risk level* | | Average level (ppm) | Range (ppm)** | Estimated average mask use by passengers(%) |
|---|
| | ‘Low’ (<800 ppm) | ‘Moderate’ (800 -1500 ppm) | ‘High’ (≥1500 ppm) | | | |
| City bus trips | | | | | | |
| Higher occupancy – ≥50% of seats occupied, sometimes with people standing in aisles (n=24 trips, 447 minutes [m]) | 5.6% | 45.9% | 48.6% | 1600 (SD=631) | 664 to 3440 | 10.6 |
| Lower occupancy – <50% of seats occupied (n=6 trips, 90 m) | 18.9% | 81.1% | 0.0% | 937 (SD=183) | 484 to 1320 | 8.7 |
| City train trips | | | | | | |
| Higher occupancy – ≥50% of seats occupied (n=5 trips, 115 m) | 22.6% | 77.4% | 0.0% | 1025 (SD=243) | 548 to 1443 | 7.8 |
| Lower occupancy – <50% of seats occupied (n=10 trips, 210 m) | 84.8% | 15.2% | 0.0% | 633 (SD=125) | 462 to 986 | 2.6 |
*These risk categories are from OzSAGE. Further details on risk are available in the Appendix.
**Lower range values can be compared to ambient CO2 levels as detailed in the Appendix.
SD: Standard deviation. All measurements made at one minute intervals.
Figure 1. Mean level of CO2 on buses and trains at different levels of occupancy.
Comment
Our results suggest poor quality ventilation in these public transport settings in Aotearoa NZ and hence that there is a likely increased risk of transmission of respiratory infections like Covid-19 whilst travelling on buses and trains. The findings are broadly consistent with the identification of poor ventilation in such settings in other NZ research (eg, a Metlink bus study and Radio NZ data collection) and in international studies (see Appendix). Even so, our research had various limitations (see Appendix) and further research in the NZ setting is highly desirable. Options for improvements are detailed below, but in the meantime, passengers and staff wishing to avoid infection in these settings should use masks, and passengers could also avoid travelling when buses and trains are crowded.
Indoor air quality standards for public transport settings
The Covid-19 pandemic has highlighted the increased occupational risks to public transport staff from exposure to airborne infections.3 So we agree with the arguments made by Metlink for the NZ Government “through the Ministry of Health, to develop a common set of indoor air quality standards for public transport in New Zealand” [Greater Wellington communication with Dr Telfar Barnard on 2 June 2023]. Potentially, buses and trains could be required to monitor and display on screens continuous indoor CO2 readings so that passengers are able to make more informed decisions about personal safety, such as wearing a mask or travelling when public transport is not crowded.
Specific design improvements
There is experimental evidence of aerosol dispersion in buses that “quantifies the effectiveness of using on-board fans, opening of various windows, use of face coverings or masks, and the use of the transit bus HVAC system”.1 Others have recommended opening all the bus doors at every stop, through to design improvements in bus ventilation systems such as intelligent ventilation4 (see the Appendix for a more complete list). Transport companies and local and central government should assess the relevance of these recommendations for the NZ situation, for both buses and trains.
Passenger density reduction
There could be additional central/local government action to increase bus and train services at peak times, to reduce the levels of crowding (as also recommended elsewhere5). Greater use of price incentives could encourage passengers to shift more travel to off-peak hours. Improving walking and cycling infrastructure in urban areas could also reduce peak demand for public transport. In addition, there is supporting working from home, albeit as appropriate for different workplaces.
Mask use on public transport
This study also identified low mask use by passengers in these public transport settings. These findings contrast with evidence for risk reduction from mask use in buses1 and persisting high mask use in some overseas settings at the same time as this study. For example, the first author observed levels of mask use on the Taipei Metro in Taiwan in the 90% to 98% range during May 2023 (when mask use was also voluntary). A possible response is for the NZ Government to fund studies on mask use by the NZ public and by public transport staff. Eg, what types of media campaign might be worthwhile and cost-effective for increasing understanding of the value of masks in public transport settings?
What is new in this Briefing?
- This study in selected NZ cities, found that in buses and trains with ≥50% of seats occupied, ventilation was typically poor (≥800 ppm) 94% and 77% of the time respectively. Levels of CO2 steadily rose with the level of occupancy. This poor indoor air quality represents an increased risk of infectious disease transmission (eg, Covid-19) in these settings.
- This picture of poor ventilation in bus and train settings is consistent with other NZ and international research.
- In these settings the estimated passenger mask use was relatively low (range 2.6% to 10.6%).
Implications for public health practice and policy
- There is a need for more extensive and systematic studies of indoor air quality and risk of respiratory infection transmission in public transport in Aotearoa NZ.
- Central Government should consider developing national indoor air quality standards for public transport.
- Transport companies should consider design and operational ventilation improvements in these transport modes. The simplest improvement that bus companies could implement immediately is encouraging bus drivers to open both doors at each stop and thoroughly ventilating the bus at the end of each run.
- Central/local government could also act to reduce crowding on bus/train services (eg, by expanding peak hour services and lowering the price for off-peak services).
- In the meantime, passengers and staff wishing to avoid infection in these settings should wear masks and (for passengers), avoid travelling in buses and trains when crowded.
Appendix
Extra background on ventilation and the Covid-19 pandemic in NZ
In response to the Covid-19 pandemic, numerous public health experts in Aotearoa NZ have called for improvements in indoor ventilation,6-10 as have school principals.11 There has also been research on ventilation in schools,12 13 with a Ministry of Education study finding suboptimal ventilation 33.4% of the time.13 Poor ventilation has also been identified in a sample of early childhood centres.14 In response to such concerns, the NZ Ministry of Education in 2022 distributed more than 12,500 portable CO2 monitors to all state and state-integrated schools to help assess ventilation in these settings.”15
Additional method details
We collected data on CO2 levels (parts per million, ppm) with Aranet4 monitors, with sampling being a mix of convenience sampling and purposeful sampling (the latter to get data for low occupancy trips). For each trip we completed a standardised data form. Specific details are as follows:
- At the start of the study all Aranet4 devices (v0.4.10) were calibrated using relatively unpolluted outdoor air (typically at around 417 ppm) as per the Aranet4 app settings (for smartphone apps). The devices were also set to make recordings at one-minute intervals.
- We aimed to sit as close as to the middle of the bus/train carriage compartment as possible. We recorded the seat location where sitting eg, “in bus, row behind back door, right side by window”; “in train, middle of carriage, three rows back from door, window seat”.
- During travel, the monitoring devices were positioned on top of a bag on the researchers lap, while obscured from public view with a magazine/smartphone. We recognise that ideally the device should have been 1 metre away from the nearest person – but this was not feasible in these settings. Hence, we purposefully collected some data in low occupancy trains and buses to allow for comparisons.
- At the estimated peak level of passenger numbers during each trip, we estimated the percentage of seats in the carriage compartment occupied (within the nearest 10%) and the extent of aisle space occupied by standing passengers. Similarly, we also estimated the proportion of passengers wearing masks at peak occupancy. To improve the accuracy of the latter, attempts were made to count people with and without masks (eg, for a section of clearly visible seated people on the researchers’ arrival and/or for all the people subsequently entering the bus during that trip).
- Data was downloaded from the Aranet4 devices at the completion of each trip and analysed in Excel.
Risk categories for CO2 levels and ambient levels
The risk categories used in Table 1 are from OzSAGE.16 Similarly, the level of <800 ppm represents “good ventilation” according to the CDC.17 Also, a UK Government agency states that “CO2 levels consistently higher than 1500 ppm in an occupied room indicate poor ventilation and you should take action to improve it.”18 In the NZ setting, the Ministry for Education has recommended that schools take action when CO2 levels within classrooms exceed 800 ppm.15 In comparison, the levels of CO2 in unpolluted ambient air are 417 ppm, as measured by NIWA at Baring Head. But in cities with some level of air pollution, outdoor air can typically have CO2 levels in the 420 to 550 range.
Study limitations
- In this work, the sampling was largely convenience sampling, did not involve large numbers of trips, and only involved buses/trains in a limited number of cities (ie, Lower Hutt, New Plymouth, Upper Hutt, Wellington, and Whangarei).
- The sampling devices could not be positioned the desired one metre away from the researcher (given the nature of the travel). As such there could have been some small impact on the results from the researchers’ own exhaled CO2. Variable levels of outdoor air pollution drifting into the buses and trains could also have made some contribution to the results (but possibly this would have been negligible – see the Metlink study detailed below).
- The devices used were calibrated in different locations using ambient outdoor air, which could have resulted in small differences between them.
Air quality improvement recommendations
Recommendations from Querol et al. 4 for air quality improvements in buses (some of which may or may not be relevant to the NZ context)
- “For buses with AC systems allowing 50% of ventilation, using this maximum outdoor air load.
- For buses allowing opening windows and trapdoors, keeping these permanently opened with signs informing that these have to be left opened.
- For buses not allowing opening windows (hermetically closed buses), installing openable ones along the buses.
- For hermetically closed buses, keep waiting with open doors in some stops until the green of the traffic lights to favour ventilation.
- Opening all the bus doors in every stop, with and without passengers entering, extending the opening time of all doors until the access of the last passenger. [Note by Briefing authors: Using this approach may need to be balanced with issues such as avoiding infiltration of outdoor pollutants inside the bus (eg, if idling diesel vehicles are nearby) or on avoiding excessive cooling on very cold days].
- Limiting the number of passengers to allow better ventilation with the same outdoor air flow.
- Online measuring the number of occupants and CO2 to allow the driver to change the AC and ventilation systems to improve ventilation and reduce fuel consumption. To improve the ventilation, in hermetically closed buses, ventilation fans can be installed in the roof of the bus, which can be switched by the driver when CO2 concentrations exceed specific thresholds. In these cases, a CO2 sensor installed in the outdoor air intake is also recommended to take into account possible external CO2 contributions.
- Finally, it is greatly recommended that when manufacturing new buses the ventilation and the filtration of polluted outdoor air is considered.”
Findings in other NZ and international studies
Results from a range of overseas studies are included in Querol et al.4 They report results for buses: 1039 ppm (average, Barcelona, Spain); 2000-3000 ppm (range, Hong Kong, China); up to 3722 ppm (Taiwan); up to 2860 ppm (Harvard University, USA); 1285 to 1325 ppm (range of averages for bus drivers in Bangkok, Thailand); and 1164 ppm (average, Nanjing and Xuzhou, China). For trains they report: 1110 to 1270 ppm (averages, metro in Beijing, China); 1153 to 3377 ppm (range, Seoul, South Korea); 1267, 1131 ppm (averages for underground and above ground trains, Taiwan); and 1253 ppm and 1855 (average and maximum, metro train, Shanghai, China).
Previous NZ work is summarised in the table below.
| Data collected for a Radio NZ article in 2022* | Average of per-trip maximum readings of CO2 (SD) in ppm | Range of per-trip maximums (ppm) | Estimated average mask use by passengers (%) |
|---|
| Buses (n=15 trips) | 3494 (1427) | 871 to 5737 | >50% for all, except one was 100% |
| Trains (n=3 trips) | 1706 (632) | 1264 to 2430 | >50% for all |
| Metlink bus data (2022)** | Average of per-trip averages of CO2 (SD) in ppm | Range for all the trip values (ppm) | |
| Double-decker – lower level (n=26 trips) | 981 (534) | 433 to 2484 | NA |
| Double-decker – upper level (n=25 trips) | 1505 (1252) | 508 to 5756 | NA |
| Single level (n=38 trips) | 1065 (496) | 495 to 2297 | NA |
* Data re-analysed by us for this table, sourced from data points published on the RNZ website.19
** Data re-analysed by us for this table, sourced from tabulated data in the Appendix of a Report for the Greater Wellington Regional Council.20 This research used CO2 monitors fixed at “near roof” height within 8 different buses (two bus companies), that covered varying routes and passenger loadings. It also used other air quality monitoring devices which indicated “that there were little to no combustion gases entering the buses that would have any noticeable effect on the CO2 reading.”